
People Analytics Metrics Every HR Team Should Be Tracking in 2026
by Ryan Stoltz
Last updated
11 min read
Table of contents
- What is people analytics? (And how it differs from traditional HR metrics)
- Why are people analytics metrics essential for modern HR strategy?
- Talent acquisition & hiring metrics
- Retention, turnover & flight-risk metrics
- Engagement, experience & recognition metrics
- Performance, productivity & contribution metrics
- Diversity, equity, inclusion & belonging (DEI&B) metrics
- Learning, growth & career development metrics
- How to implement people analytics metrics in your organization
- From insight to action: Turning metrics into measurable ROI
- Choosing the right platform: How Workhuman iQ supports people analytics metrics
- Beyond the dashboard: Recognition as a signal, not just a metric
- Build a people analytics metrics playbook that evolves
Share this article
It may feel like some HR decisions are based on gut instinct, but most HR teams aren't flying blind. They have people analytics metrics dashboards. The problem isn't a lack of data. Quite the opposite. It's that by the time it surfaces, the moment to act on it has already passed.
Between hybrid work models, relentless competition for talent, and voluntary turnover rates hitting 18-20% in knowledge sectors through 2024-2025, those dashboards simply don’t cut it anymore. When 75% of knowledge workers are using AI daily – and expecting their employers to be just as data-savvy – HR teams need a new playbook.
The answer isn’t more dashboards, but smarter ones. There are two problems with how most companies run people analytics metrics:
The first problem is that they are largely retrospective— headcount reports, engagement scores, performance reviews, exit interview summaries, eNPS trends stacked quarter over quarter. All giving you a look into the past, but not the present.
The second problem is that they are not available to the right people at the right time. Locked into reports that only HR or senior leaders ever see, they never have the opportunity to change behavior in the flow of work.
There's also a third problem that most people analytics stacks are missing entirely: the data isn’t great. Decision-grade data comes from people themselves, voluntarily, about real work, in the moment. Not inferred from system activity. Not extracted through surveys.
Generated by employees with intention – when they recognize a colleague, describe what they did, and connect it to what matters. That kind of zero-party data (data which a customer intentionally and proactively shares with a brand) doesn't just tell you what happened. It tells you how work actually gets done, who's driving it, and where culture is healthy or fraying – before any dashboard catches up.
At some point, the way to solve yesterday's HR problems became today's constraint.
The real playbook here is better people analytics metrics: the key performance indicators that translate workforce behavior, culture, and employee performance into measurable business impact. These are the data points that help you predict who’s about to leave, which teams are thriving, and where your hiring process is bleeding money.
What is people analytics? (And how it differs from traditional HR metrics)
People analytics is the systematic collection, integration, and analysis of people data from multiple sources – HRIS, employee surveys, recognition platforms, performance management tools, and collaboration software – to drive evidence-based strategic decisions.
Here’s how it differs from traditional HR reporting:
| Traditional HR metrics | People analytics metrics |
| Static headcount reports | Human signals in the flow of work |
| Backward-looking payroll data | Analytics and models that guide talent decisions months or years ahead |
| Isolated HR data silos | Connected workforce data ecosystem |
| “What happened” reporting | “Why it happened” and “what’s next” forecasting |
| Consider this scenario: Traditional HR might tell you that the voluntary turnover rate increased last quarter. People analytics correlates declining recognition frequency, engagement score drops, and reduced peer interactions to identify which teams face flight risk before resignations spike. |
Workhuman® iQ™ aggregates data from social recognition, feedback, and milestone moments to create a high-resolution view of culture and performance – moving beyond spreadsheets to human resource management that actually predicts outcomes.
Why are people analytics metrics essential for modern HR strategy?
Tracking the right meaningful metrics enables HR to forecast rather than just report. Imagine predicting resignations 3-6 months ahead, identifying skills gaps before they stall projects, or flagging engagement dips while there’s still time to intervene.
Studies between 2023-2025 show that data-driven HR organizations aligned with emerging people trends outperform peers by 20-30% in productivity and retention. Teams leveraging HR analytics achieve 25% higher internal mobility and 12-point gains in employee net promoter score through targeted interventions like manager coaching.
These metrics connect directly to strategic HR priorities and workforce strategies that matter to the C-suite in 2026:
- Controlling labor costs through reduced turnover and optimized hiring costs
- Boosting productivity per FTE with engagement-driven performance
- Demonstrating DE&I progress with concrete representation data
- Minimizing regrettable turnover of your highest performers
People analytics metrics serve as the bridge between human-centric initiatives – recognition, development, flexible work – and financial business outcomes like revenue growth and customer satisfaction. Platforms like Workhuman iQ move organizations from static annual reports to always-on dashboards that business leaders can actually use.
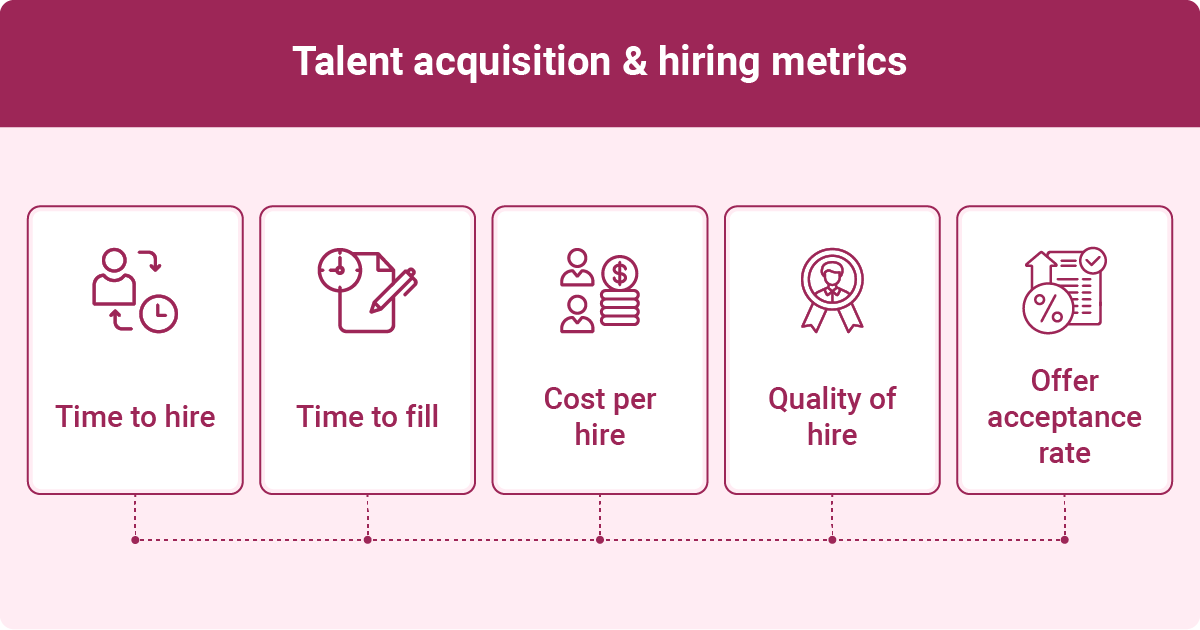
Talent acquisition & hiring metrics
In competitive markets, hiring speed and quality directly influence revenue and innovation. Every day a critical role sits unfilled costs you 0.5-1x annual salary in lost productivity. Here are the most important HR metrics for talent acquisition:
Time to hire
Days from job application to offer acceptance. Typical benchmarks:
- Professional roles: 20-30 days
- Senior leadership: 45-60+ days
Delays beyond 42 days correlate with 15-20% drops in candidate experience scores. Your average time matters more than you think.
Time to fill
Days from requisition approval to acceptance. This usually exceeds time to hire by 10-20 days and reveals upstream bottlenecks in budgeting, approvals, or employer branding. Top performers maintain under 40 days per SHRM 2025 data.
Cost per hire
Aggregates internal costs (recruiter salaries, training) and external costs (agency fees, advertising) divided by total hires. Current range: $4,000-$20,000 by role. When high cost per hire compounds with 20% first-year turnover, expenses multiply 1.5-2x.
Quality of hire
A composite metric including:
- First-year performance ratings (target >4.0/5)
- Ramp-up time (<90 days)
- Recognition frequency (1-2 instances monthly)
- 12-month retention (>85%)
Offer acceptance rate
Formula: (Accepted offers / Offers made) × 100
Healthy range: 85-92%. Dips below 80% signal compensation or employer branding issues when segmented by role, location, or different demographic groups.
| Metric | Formula | Benchmark |
| Time to Hire | Sum of days (application to acceptance) / Hires | 20-30 days (professional) |
| Time to Fill | Sum of days (req approval to acceptance) / Filled roles | <40 days |
| Cost per Hire | Total recruiting costs / Hires | $4,000-$20,000 |
| Offer Acceptance | (Accepted / Offered) × 100 | 85-92% |
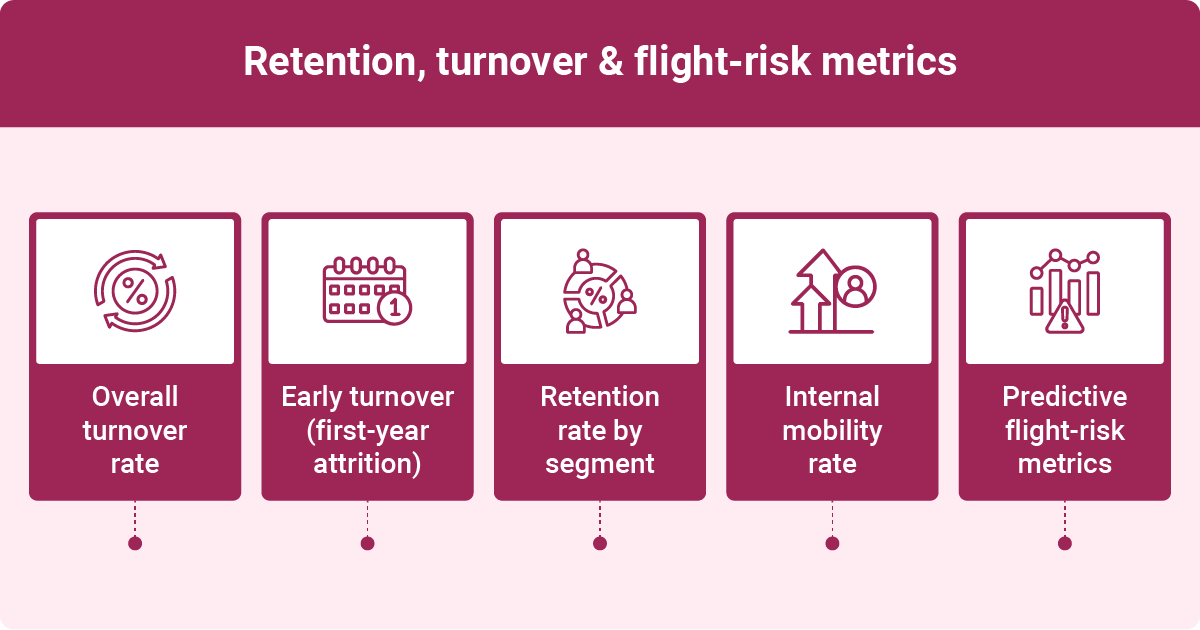
Retention, turnover & flight-risk metrics
Turnover costs are brutal: conservatively 0.5-2x salary per departure, with senior roles reaching $150,000+. That’s before you count lost institutional knowledge, delaying projects by 3-6 months. Retention strategies need data, not guesswork.
Overall turnover rate
Formula: (Separations / Average headcount) × 100
Track annually and quarterly, distinguishing:
- Voluntary vs. involuntary exits
- Regrettable vs. non-regrettable departures (how many employees you actually wanted to keep)
Voluntary rates above 10% typically trigger C-suite scrutiny. The talent turnover rate among high performers deserves special attention.
Early turnover (First-year attrition)
Track at 90-day, 6-month, and 12-month intervals:
- 90-day: <15%
- 6-month: <20%
- 12-month: <25%
High early turnover signals problems in your recruitment process, onboarding, or new employee-manager fit.
Retention rate by segment
Segment retention data by:
- Critical roles and high-potential pools (target 90%+)
- Geography and function
- Remote vs. hybrid vs. on-site
This ties directly to workforce planning and succession strategies.
Internal mobility rate
Formula: (Internal moves/Total number of employees) × 100
Target: 10-15% annually via promotions, lateral moves, and cross-functional transfers. Stalled mobility doubles future attrition risk.
Predictive flight-risk metrics
Here’s where people analytics gets powerful. Combining signals predicts resignation risk:
- Declining recognition frequency (drops >30% signal 40% higher resignation odds)
- Increased absenteeism
- Engagement score drops
- Reduced peer interactions
Workhuman iQ’s retention forecasting achieves 75-85% prediction accuracy by analyzing social recognition and milestone data – enabling cohort analyses that spotlight manager-level hot spots before employees leave.
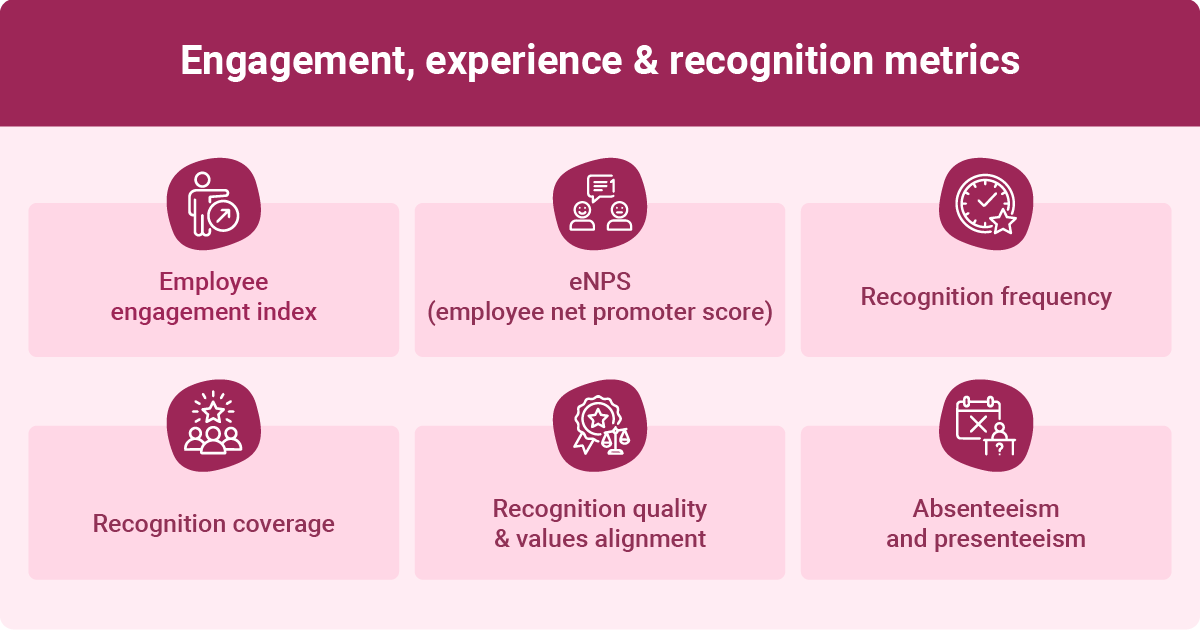
Engagement, experience & recognition metrics
Engagement and daily employee experience are leading indicators of performance, innovation, and retention. Gallup’s 2023-2025 meta-analyses show that a 1-point engagement index gain correlates with 21% higher productivity and 37% lower absenteeism. Disengaged employees cost you more than you realize.
Employee engagement index
Structure: 10-30 survey items covering connection to work, manager, and organization, scored on a 1-5 scale. Benchmark: 4.0+ is healthy.
Cadence matters: Annual comprehensive surveys plus quarterly pulse checks reveal trends like hybrid work dips.
eNPS (Employee Net Promoter Score)
Formula: % Promoters (9-10) - % Detractors (0-6)
Range: -100 to +100. Scores of 50+ are excellent. Like customer satisfaction’s net promoter score, this tells you who’d recommend your company as a workplace.
Segment by team and demographic to measure employee satisfaction across the organization and uncover hidden pockets of concern, using targeted workplace culture surveys to surface specific issues.
Recognition frequency
Unlike survey data or HRIS transactions, recognition data is generated by people about real work, in the moment – making it the most reliable signal in your people data stack.
Target: At least one meaningful recognition every 4-6 weeks (healthy range: 0.5-2.0 moments per employee monthly).
Recognition coverage
Percentage of employees giving and receiving recognition in a given period. Target: 80-90%.
Low coverage highlights disparities – sales teams might hit 95% while IT languishes at 60%.
Recognition quality & values alignment
“Tagged” recognition moments linked to core values or strategic objectives reveal how culture shows up in daily work. This isn’t just feel-good data; it’s insight into whether HR initiatives are actually landing.
Absenteeism and presenteeism
- Absenteeism rate: (Absent days / Available workdays) × 100. Target: <2-3%
- Presenteeism: Self-reported low-productivity days. Norm: 10-15%
Persistent unplanned absences often correlate with low engagement – and predict future departures.
Real-world example: One team’s 25% recognition surge preceded 15% productivity gains and 10% churn reduction within a single quarter. Employee feedback confirmed they felt more valued.
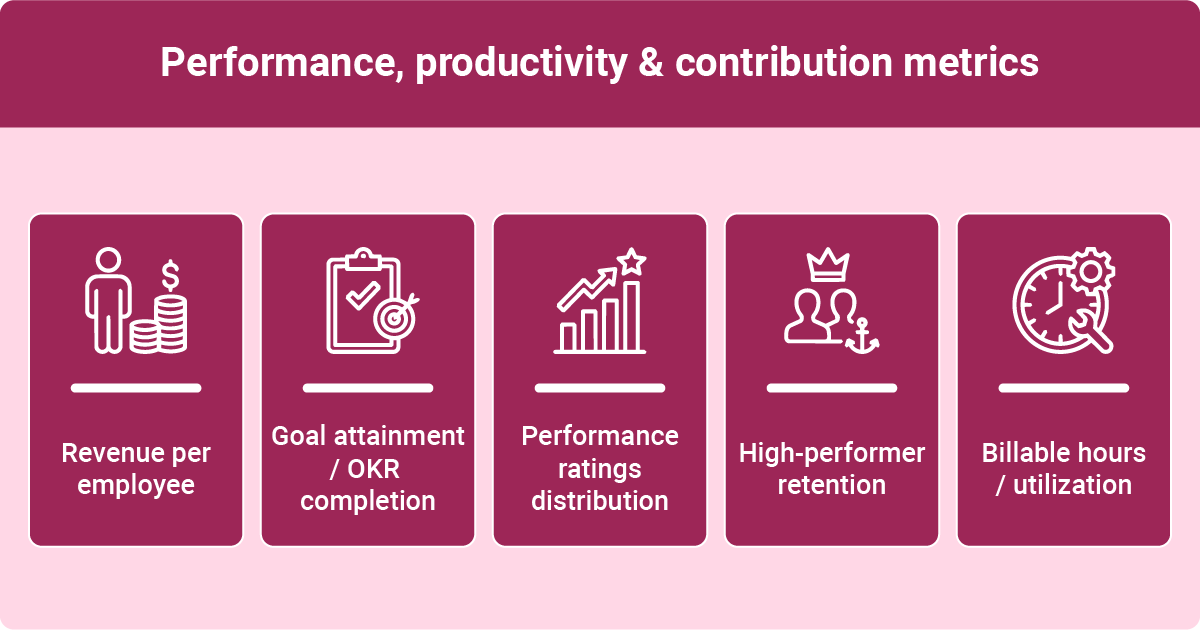
Performance, productivity & contribution metrics
People analytics should link to measurable contribution and business outcomes – not just whether people are happy. Here’s how to track employee productivity and performance in ways that matter.
Revenue per employee
Formula: Total revenue / Average FTE headcount
Benchmarks vary by industry: tech firms often hit $400K+ while manufacturing averages $200K-$300K. Track trend lines across years and benchmark against peers for organizational efficiency insights.
Goal attainment / OKR completion
Track the percentage of company, team, and individual goals achieved quarterly using a structured Objectives and Key Results (OKR) framework. Correlate with engagement and recognition data to understand what drives business productivity.
Healthy range: 70-85% completion. Watch for rating inflation that obscures actual performance.
Performance ratings distribution
Analyze rating curves to avoid inflation or bias. Ideal distribution: 10% top performers, 70% core contributors, 20% development needed.
High-performer retention
Track retention rate of your top 5-10% (whether identified by ratings, recognition volume, or both). Losing these performers costs 3-5x salary in revenue impact – a direct hit to company growth.
Billable hours/utilization
For services and consulting organizations, target 80-85% utilization. But watch how this intersects with overtime and burnout risk.
Workhuman iQ can surface hidden high performers by identifying individuals frequently recognized across teams – even before formal ratings catch up. This gives HR professionals a head start on talent development and retention strategies.
Mini-case study: A sales unit saw recognition volume rise 40%, engagement jump 15 points, and OKR completion increase from 65% to 82% – yielding 18% revenue per employee growth. Recognition wasn’t just nice; it drove business success.
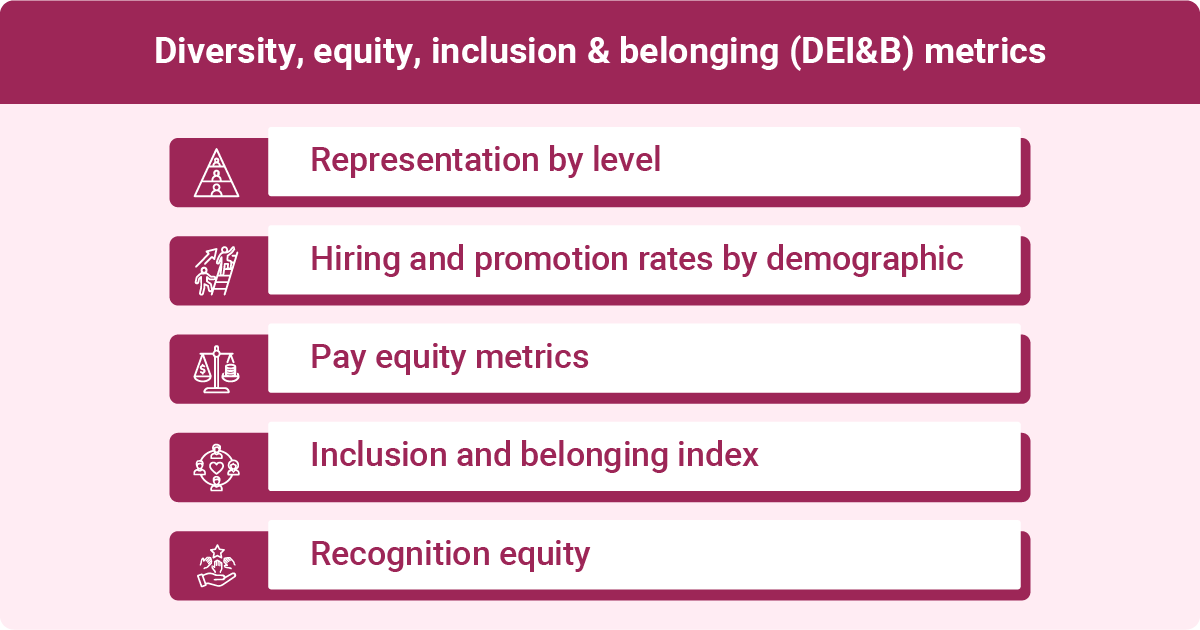
Diversity, equity, inclusion & belonging (DEI&B) metrics
DEI&B is now a board-level priority. Metrics move it from good intentions to accountability – and help identify systemic barriers hiding in your HR processes.
Representation by level
Track gender, race/ethnicity, and age across the hierarchy:
- Individual contributors
- Managers
- Directors
- VP and above
- C-suite
2025 data shows the C-suite remains 70%+ male and white in many industries. Longitudinal tracking over 2-3 years demonstrates real progress.
Hiring and promotion rates by demographic
Gaps reveal systemic barriers. For example, women promoted at 0.8x men’s rate indicates a pipeline problem requiring intervention.
Pay equity metrics
Track three dimensions:
- Unadjusted pay gap: Target <10%
- Adjusted pay gap (controlling for role/tenure): Target <5%
- Salary range penetration: Where employees fall within pay bands
Inclusion and belonging index
Build from employee surveys measuring psychological safety, fairness, voice, and feeling valued. Benchmark: 4.0+ on a 5-point scale. Include ERG participation data (target: 20%+ workforce involvement).
Recognition equity
Workhuman iQ measures who receives recognition across demographic groups, functions, and locations – surfacing biased patterns. If underrepresented groups receive 30% less recognition, that’s a culture problem with retention implications that can be addressed with a robust social recognition platform.
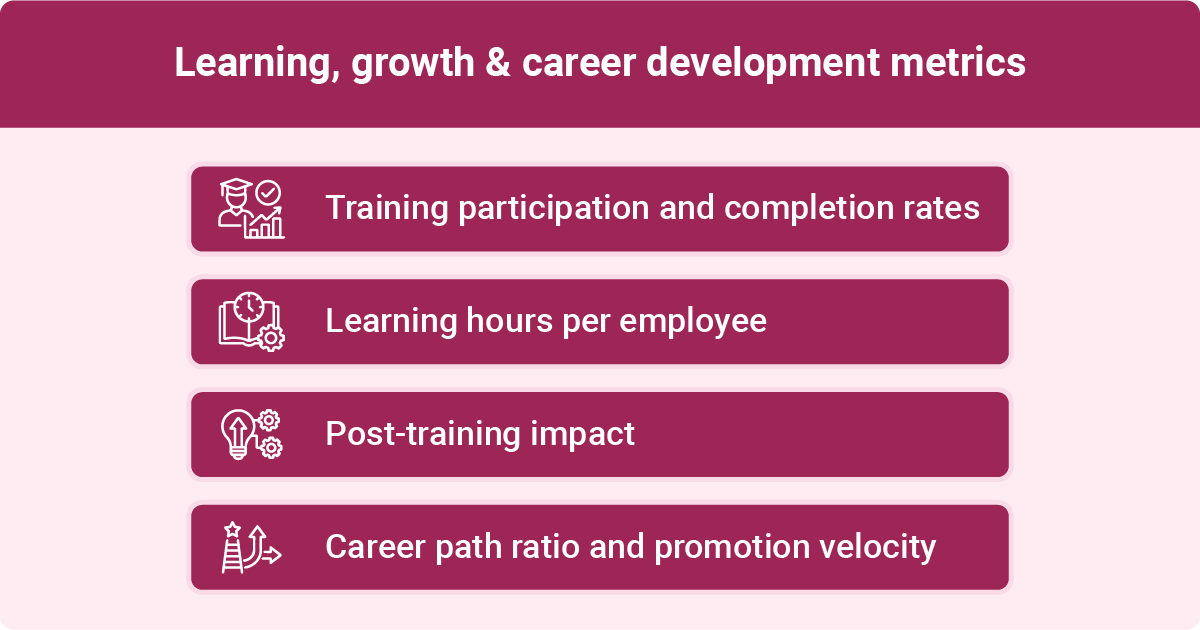
Learning, growth & career development metrics
In fast-changing markets – AI adoption, new regulations, evolving skill requirements – upskilling and internal mobility build organizational resilience. These metrics demonstrate whether your development investments deliver a competitive advantage.
Training participation and completion rates
Target: 80-90% completion. Track by level, function, and demographic to ensure equitable access to training and development initiatives.
Learning hours per employee
Benchmarks: 40-60 hours annually by role and industry. Note diminishing returns beyond 80 hours – more isn’t always better.
Post-training impact
Measure skill adoption via:
- Manager ratings improvements
- Performance metric shifts
- Recognition tags related to new skills or behaviors
Career path ratio and promotion velocity
- Career path ratio: Balance of promotions vs. lateral moves (ideal 1:2)
- Promotion velocity: Average time to promotion by cohort (18-24 months typical)
Link development activity to later retention and engagement scores to demonstrate ROI to business executives. Organizations with active development programs see 2x higher retention among participants.
Workhuman iQ can identify employees exhibiting “learning behaviors” through feedback and recognition related to new competencies – a leading indicator of future high performance.
How to implement people analytics metrics in your organization
Here’s a practical roadmap to build your analytics maturity without boiling the ocean:
Step 1: Define business questions: What does your business strategy need to know? Retention risks? DEI progress? Hiring efficiency? Start with 3-5 priority questions.
Step 2: Choose a focused starter set: Begin with 10-15 core metrics across recruitment, retention, engagement, performance, and DEI&B. You can expand later.
Step 3: Audit data sources: Map your current HRIS, ATS, recognition platform, survey tools, and performance systems. Identify gaps and ownership.
Step 4: Build integration: A central analytics platform matters. Workhuman iQ plugs into existing HR software stacks to consolidate recognition, engagement, and culture metrics into ready-to-use dashboards.
Step 5: Create role-based dashboards:
- Executives: High-level trends tied to strategic objectives and business objectives
- HRBPs: Segment-level detail for informed decisions
- Managers: Team-level insights with clear actions
Step 6: Prioritize privacy and ethics: Set aggregation thresholds (minimum 5-10 employees per data slice), ensure transparency with employees, and avoid “spyware” perceptions. Data-driven decisions require data trust.
From insight to action: Turning metrics into measurable ROI
Metrics only matter if they drive behavior change and investment decisions. Here’s how to translate valuable insights into dollars.
Quantify impact
Connect metric shifts to financial terms:
- 3-point engagement lift → 5-10% voluntary turnover drop → $1M+ savings per 1,000 FTEs
- Recognition program implementation → 20-30% performance gains in pilot groups
Run experiments
Use A/B tests or pilot programs: one business unit introduces a recognition initiative or manager training while others serve as controls. Compare results over 6-12 months. This turns HR efforts into provable business outcomes.
Build quarterly reviews
Establish “People Analytics Business Reviews” mirroring financial QBRs. Walk business leaders through:
- Trend analysis against key business outcomes
- Root cause identification
- Recommended actions with projected ROI
Choosing the right platform: How Workhuman iQ supports people analytics metrics
Workhuman iQ transforms the metrics discussed throughout this guide from aspirational to achievable:
Key capabilities:
- Real-time recognition and engagement metrics across 180+ countries and 30+ languages
- Inclusion-aware analytics surfacing recognition equity gaps
- Talent and retention risk insights predicting flight risk before resignations
- Trend analysis connecting culture behaviors to a company’s success
Human Intelligence (AI + People data): Workhuman iQ uses decades of global recognition data to surface hidden talent, predict turnover with 85% accuracy, and highlight culture strengths and gaps – all without the manual spreadsheet work that delays insights by months.
Manual reporting vs. Human Intelligence:
| Manual approach | Human Intelligence |
| Quarterly spreadsheet updates | Signals and advice are shared in the flow of work |
| Siloed HR data | Integrated recognition + engagement + performance |
| Lagging indicators | Predictive forecasting |
| Generic reports | On-demand answers for managers, HRBPs and executives. |
| Ready to transform your organization’s approach to people analytics? A data-driven recognition and culture program powered by Workhuman Cloud and Workhuman iQ measurably improves engagement, performance, and retention – with ROI you can track and justify to any skeptic. |
Beyond the dashboard: Recognition as a signal, not just a metric
There's a limit to what metrics can tell you, and it's worth understanding before you build your entire people analytics strategy. Dashboards are excellent at summarizing what happened. They're less useful for steering what happens next.
The dashboards HR spent years building may now be the constraint, and what leaders actually need are human signals: real-time, in-context, delivered where decisions get made.
The distinction matters when you think about recognition data specifically. Every other data source in your people analytics stack – HRIS transactions, survey responses, LMS completions – is either inferred, lagging, or generated by the system.
Good recognition data is different. It's voluntary, first-party, written by people about real work, in the moment. That combination of intent and authenticity makes it the most reliable signal you have.
What Human Intelligence does with that signal is the more important story: it doesn't just report on recognition — it reads the language inside it, connects it to values, skills, teams, and strategic priorities, and delivers those findings where they're actually useful. Not in a quarterly dashboard review. In the flow of Tuesday's decisions.
Build a people analytics metrics playbook that evolves
Focusing on a more human set of people analytics metrics gives HR strategic credibility and a clear line of sight to business outcomes. The path to success isn’t adding more dashboards, but getting data out of the box. That means tracking and elevating what matters in real time and acting on it.
Your metrics should evolve with strategy. Growth phases emphasize time to hire and quality of hire. Maturity phases shift toward internal mobility and skills development. Build a productive workforce by measuring what your current challenges demand.
Start small: pick a few high-impact metrics like recognition frequency, voluntary turnover rate, eNPS, and internal mobility. Deepen from there as your capabilities grow.
Your workforce is already telling you what they need through their behaviors, engagement patterns, and recognition moments. A Human Intelligence platform like Workhuman helps you finally hear them – accelerating the journey from raw people data to culture, performance, and retention breakthroughs.
The data is there. The insights are waiting. What you do next determines whether HR remains a cost center or becomes the strategic engine driving your company's growth.

Ryan Stoltz
Ryan is a search marketing manager and content strategist at Workhuman where he writes on the next evolution of the workplace. Outside of the workplace, he's a diehard 49ers fan, comedy junkie, and has trouble avoiding sweets on a nightly basis.
Recommended for you