
Employee Engagement Statistics: Benchmarks, Costs, and What the Data Shows
by Ryan Stoltz
Last updated
10 min read
Table of contents
- What percentage of employees are engaged at work?
- What is a good employee engagement score?
- How does employee engagement affect productivity and profitability?
- How much does employee disengagement cost?
- What do engagement statistics say about the biggest drivers?
- How does recognition show up in employee engagement data?
- FAQs
Share this article
Your HR team has a great idea to increase engagement, but when you take the plan to leadership, you hear a familiar refrain: "Show me the numbers." Then, when you try to find a solid number for your presentation, you quickly realize employee engagement statistics are a mess.
Some articles use global and U.S. figures interchangeably, and the cost estimates for disengagement vary widely. It's also hard to pin down how many employees actually feel engaged.
Perceptyx’s “The 2026 Benchmark Report” noted 81% of employees were engaged in 2025, while Gallup’s “State of the Global Workplace 2026” report put global engagement at just 20%. Part of the issue is that sources don't always agree on what employee engagement actually means.
With your credibility on the line, you're probably wondering which numbers to use.
What percentage of employees are engaged at work?
Gallup’s “State of the Global Workplace: 2026Opens in a new tab” report provides a breakdown of employee engagement across global and U.S. workplaces in 2025, offering a benchmark for organizations working to build an engaged workforce.
Global employee engagement rate
Global engagement fell from 23% in 2022 to 21% in 2024 and 20% in 2025. This was the lowest level since 2020. The remaining workforce was split between employees who were not engaged (64%) and those who were actively disengaged (16%).
U.S. employee engagement rate
In the U.S., engagement peaked at 33% in 2021 before falling to 31% in 2025, its lowest level since 2017, when it was also 31%. Additionally, 52% of U.S. employees were not engaged in 2025, while 17% were actively disengaged.
Recent Gallup employee engagement data, “Employee Engagement Remains Flat as AI Adoption Accelerates,” shows that these trends have continued into the first half of 2026. Engagement in the U.S. remained flat at 31%, while the percent of actively disengaged employees had inched up to 18%.
Engaged, not engaged, and actively disengaged
As Gallup’s “Indicators: Employee Engagement” explains, the company categorizes employees into three groups:
- Engaged employees are "highly involved in and enthusiastic about their work and workplace."
- Not engaged employees are "psychologically unattached to their work and company."
- Actively disengaged employees are "resentful that their needs aren't being met and are acting out their unhappiness."
These categories are based on Gallup's “Q12® survey.” It uses 12 questions to measure four levels of employee needs, including basic needs, individual contribution, teamwork, and growth. This method is more in-depth than simply looking at satisfaction scores or the percentage of favorable survey responses.
Engagement rates by region and country
Culture and geography may influence employee engagement trends. According to Gallup's 2026 report, Uzbekistan had the highest engagement rate in 2025 at 46%. Egypt and Pakistan were tied for the lowest rate, with only 4% of employees engaged in both countries.
Regionally, the U.S. and Canada had the highest rate at 31%. Europe was the lowest-scoring region with a 12% engagement rate.
What is a good employee engagement score?
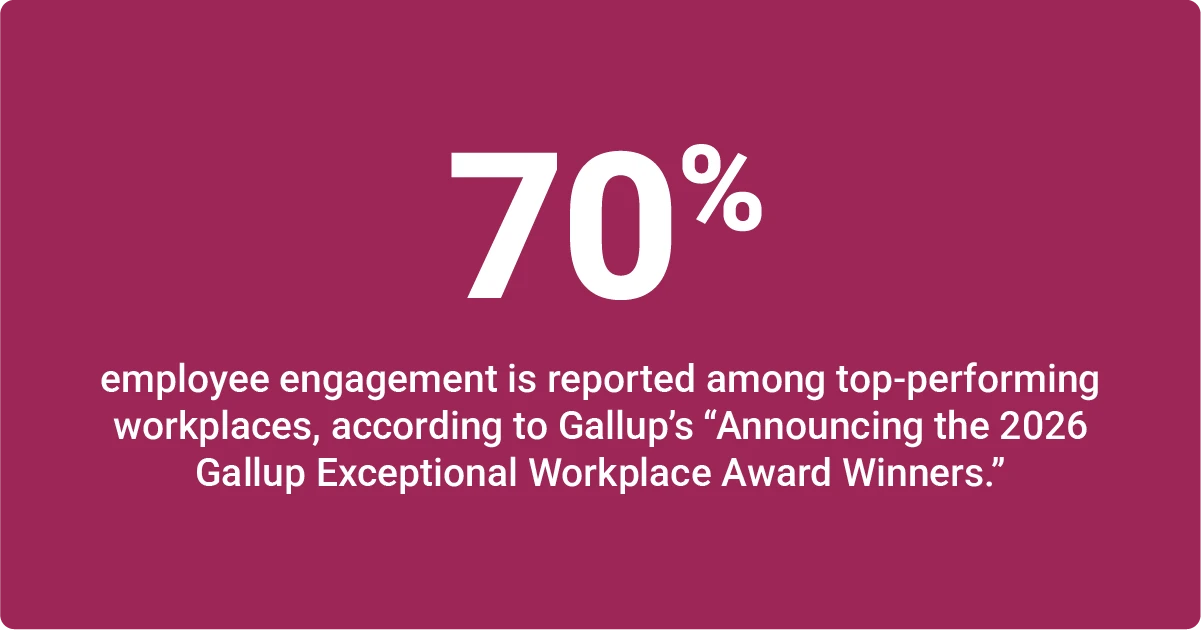
Top-performing workplaces have around 70% employee engagement, according to “Announcing the 2026 Gallup Exceptional Workplace Award Winners.” That's the average rate for organizations that received the Gallup Exceptional Workplace Award (GEWA) in 2026.
However, lower scores can still be considered good when viewed in context, including industry benchmarks, historical performance, and the methods used to measure engagement. For example, a score above the U.S. average of 31% may be a positive indicator, depending on these factors.
Gallup's benchmark for top-performing organizations
Gallup research has found that high engagement is often associated with positive business outcomes that contribute to overall organizational success.
For instance, when the company compared engagement metrics for the top- and bottom-quartile business units, it found 81% lower absenteeism and a 64% difference in safety incidents.
Why vendor benchmarks report much higher numbers
Sources often disagree about how to measure employee engagement level. Software vendors often rely on percent-favorable survey results, while Gallup uses its 12-question survey to classify employees by engagement level and examines how those levels relate to business outcomes. That can lead to wildly different statistics.
Here's a quick comparison of the employee engagement rate in 2025 from popular vendors:
- 81% according to Perceptyx’s “2026 Benchmark Report” (drawing on over 23 million employee responses in 113 countries)
- 8.1 out of 10, based on CultureMonkey's benchmark dataset “Employee engagement benchmarks, from real survey data” (which includes 11 million employee survey responses across five regions)
- 68% for workers aged 25 and older, according to the Qualtrics “2026 Employee Experience Trends” report (drawing on responses from 33,831 employees across 24 countries)
How to compare engagement scores across scales
Researchers use different approaches to measure employee engagement and understand its relationship to business outcomes:
- Percent-favorable surveys ask employees questions about their experiences at work and calculate how many give positive responses. Suppose a survey asks, "How satisfied are you with your job?" If 10% say "very satisfied" and 30% say "somewhat satisfied," a percent-favorable survey would report that 40% of employees gave positive responses.
- Outcome-linked research examines how employee engagement scores relate to workplace outcomes. For example, researchers might compare engagement scores with turnover and absenteeism rates.
Percent-favorable scores can help you understand how your employees feel. However, you may have to do extra work to connect those scores to business results.
Outcome-linked research can reveal how engagement relates to business performance, but it should complement, rather than replace, insights into your team’s actual experiences.
If you want to benchmark your own results, make sure you compare them to employee engagement stats that use the same methods. Otherwise, your scores may seem much higher or lower than average.
Where employee engagement data comes from
Organizations often use annual employee engagement surveys and employee pulse surveys to ask about the employee experience. These instruments provide snapshots of how workers feel at that moment.
Performance data can also give you clues about employee engagement. You may notice that highly engaged employees and teams tend to be more productive and have fewer errors. If your finance department's productivity rate suddenly drops, you might investigate whether anything is affecting the team's engagement.
You can also complement this data with internal exit interviews and absenteeism and turnover metrics. These sources may help you spot patterns that drive disengagement, such as a micromanaging team leader.
Beyond individual organizations, many researchers conduct large-scale workforce studies. One example is the “Gallup World Poll,” an annual survey that covers over 140 countries. These studies can help you understand broader trends, though they may not reflect your own organization.
How does employee engagement affect productivity and profitability?
According to the eleventh edition of Gallup's “Q12 meta-analysisOpens in a new tab,” business units in the top quartile for employee engagement had higher productivity and profitability than those in the bottom quartile.
Top performers had 23% higher profitability, 14% higher productivity on production records and evaluations, and 18% higher productivity on sales measures.
What the Gallup Q12 meta-analysis measures
Gallup uses these studies to compare business units in the top and bottom quartiles for employee engagement. This approach helps researchers understand the relationship between employee engagement, productivity, and other business outcomes.
Profitability and productivity gains
According to the Gallup Q12, here are the median percent differences between top-quartile and bottom-quartile units:
- 23% in profitability
- 18% in productivity for sales and 14% in productivity on production records
It also found that units scoring in the top half of engagement are twice as likely to be successful as those in the bottom half.
Customer, quality, and attendance outcomes
The Gallup Q12 found that employee engagement is connected to many other outcomes. Top-quartile business units have:
- 10% higher customer loyalty and engagement
- 32% fewer quality defects
- 51% lower turnover for low-turnover organizations
- 78% fewer absences
A separate study from Workhuman® and Gallup, “Amplifying Wellbeing at Work and Beyond,” shows how employee engagement and wellbeing often go hand-in-hand.
This large-scale study included over 12,000 employees in 12 countries. It found that employees who lack meaningful connections at work are nine times as likely to be disengaged and three times more likely to be looking for another job.
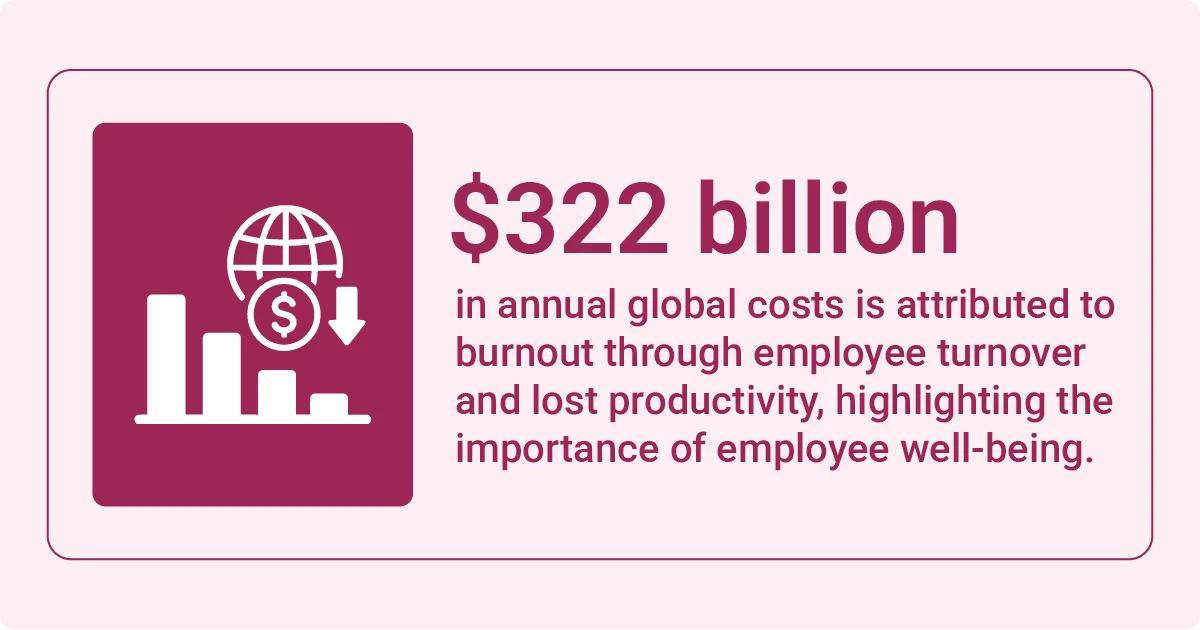
Poor employee wellbeing and engagement can have consequences beyond job satisfaction and company culture, including high financial costs. Low wellbeing can also turn into burnout, which costs $322 billion globally in turnover and lost productivity.
How much does employee disengagement cost?
Gallup's “State of the Global Workplace 2026” estimates that the global cost of disengaged employees is about $10 trillion a year in lost productivity. That's approximately 9% of the gross domestic product (GDP).
The global cost of low engagement
The estimated cost has risen from $8.8 trillion in 2023 to $10 trillion in 2025, highlighting the growing economic impact of low employee engagement.
The U.S. cost of disengagement
In the United States alone, Gallup’s “Anemic Employee Engagement Points to Leadership Challenges” estimates that employee disengagement cost around $2 trillion in lost productivity last year.
This is much higher than a previous estimate from Gallup's “2013 State of the American Workplace” report. In this earlier study, the company reported that actively disengaged workers cost the U.S. between $450 billion and $550 billion a year.
These figures aren't directly comparable. The earlier estimate focused exclusively on actively disengaged employees, while the more recent estimate includes the broader population of employees who are not engaged or actively disengaged.
What employee burnout costs employers
Employee disengagement and burnout can both have significant financial consequences for organizations.
A 2025 study published in the American Journal of Preventive Medicine, “The Health and Economic Burden of Employee Burnout to U.S. Employers,” estimates the annual cost of burnout per employee, based on their role, at:
- $3,999 for a non-managerial hourly employee
- $4,257 for an average non-managerial salaried employee
- $10,824 for an average manager
- $20,683 for an average executive
Why cost estimates vary so widely
- Different scopes: Some reports examine the global economy, while others calculate the economic impact within a single country. Still others focus on the individual level, estimating the cost of a single disengaged or burned-out employee.
- Different populations: One report might only include actively disengaged employees, while another considers everyone who isn't engaged.
- Year of the report: Employee engagement levels, workforce populations, economic conditions, and research methodologies can change over time, affecting cost estimates.
- Which costs count: Some studies, like “Presenteeism: A Public Health Hazard,” published in the Journal of General Internal Medicine, consider both the costs of presenteeism and absenteeism, while others only include absenteeism.
What do engagement statistics say about the biggest drivers?
Relationships with managers are one of the primary factors that drive employee engagement rates. Other influences on the employee experience include understanding expectations, getting regular feedback, trusting leadership, adapting to AI, and work location and flexibility.
Managers explain most of the variance
According to Gallup's “Indicators: Employee Engagement,” managers account for at least 70% of the variance in employee engagement across teams. Everyday interactions (or the lack of them) with these leaders can greatly affect the employee experience.
One Workhuman and Gallup report, “Transforming Workplaces Through Recognition,” found that only 21% of employees say they receive recognition from a manager a few times a week, while 40% only get recognition a few times a year.
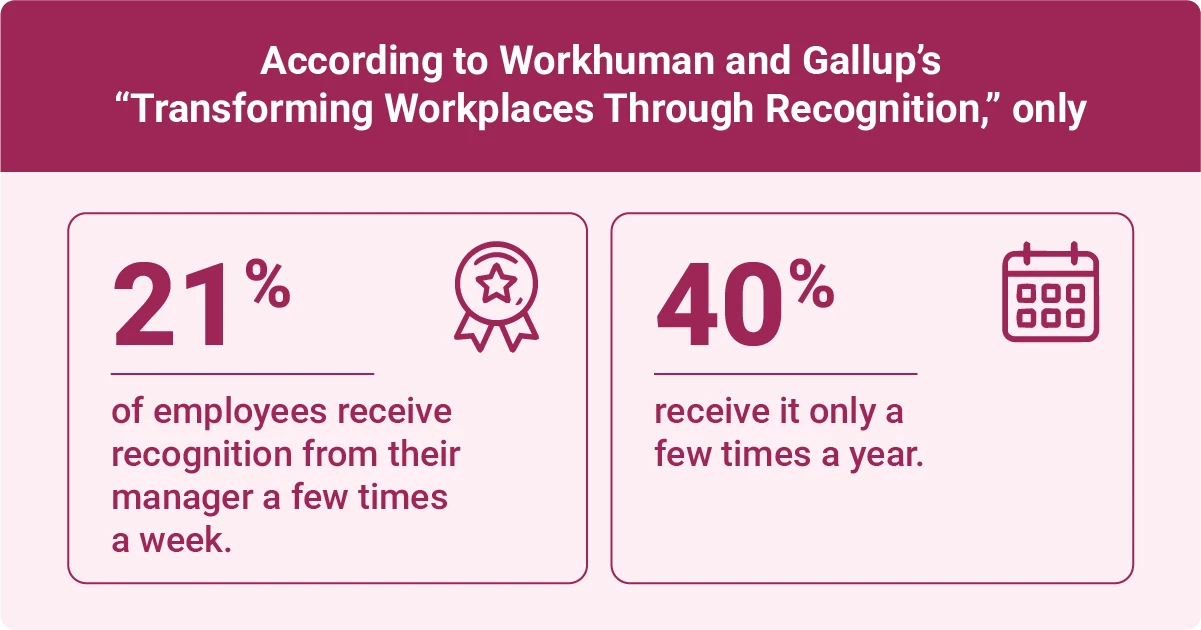
The consequences of infrequent recognition can be high. Employees who only receive recognition from their managers a few times a year are five times as likely to be actively disengaged as well-recognized peers. They're also 74% more likely to say they don't plan to be at their organization in one year.
Managers themselves aren't always engaged at work, either. Gallup's “2026 State of the Global Workplace” report found that global manager engagement dropped from 31% in 2022 to 22% in 2025.
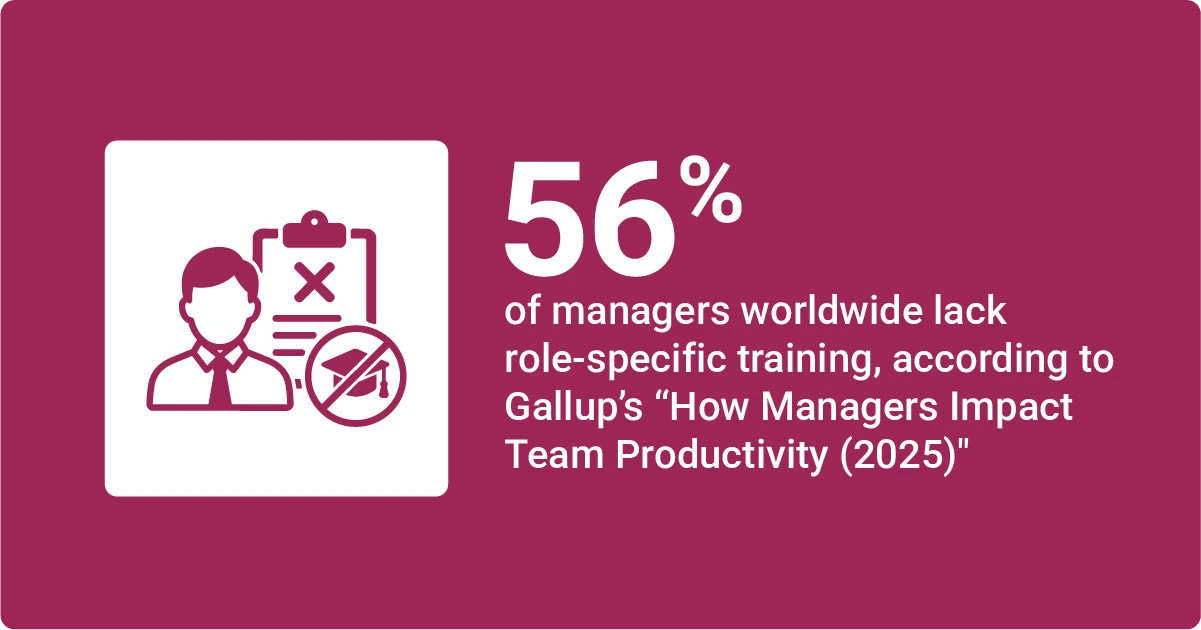
A lack of preparation may contribute to this decline. A 2025 Gallup report, “How Managers Impact Team Productivity,” revealed that 56% of managers globally didn't receive any training for their roles.
Clarity of expectations and feedback
Clarity is another major driver of engagement. Gallup's “Indicators: Employee Engagement” shows that only 49% of U.S. employees say they know what's expected of them at work.
Measuring feedback frequency can help you track workplace engagement and identify where employees may need more guidance. For instance, people who rarely receive recognition may need more guidance to feel engaged.
Change management and leadership trust
Perceptyx’s “The 2026 Benchmarks Report” shows that highly engaged employees are 1.9 times more likely to say their organizations handle change effectively. They may feel more involved in these transitions, or at least more secure in their companies.
Whether employees trust senior leadership is another factor that influences engagement. Gallup's “Indicators: Leadership and Management” show that only 20% of U.S. employees said they trusted their organization's leadership in 2026.
AI adoption and engagement
The role of AI in employee engagement remains relatively unknown. However, a 2026 Gallup article, “Employee Engagement Remains Flat as AI Adoption Accelerates,” suggested that access alone to this technology doesn't improve or hurt the employee experience.
In other words, just handing someone AI tools might make them more productive, but that doesn't necessarily lead to higher engagement.
These best practices can help you use AI to improve employee engagement:
- Set clear expectations for appropriate AI usage.
- Create implementation plans with training.
- Encourage managers to provide support.
Work location, flexibility, and engagement
Employee engagement also varies by work arrangement. Gallup's “Indicators: Hybrid WorkOpens in a new tab” shows that 37% of exclusively remote employees are engaged, compared to 34% of hybrid and 28% of onsite employees. Increased flexibility may boost engagement by giving employees more autonomy.
Relationships with coworkers matter, too. “Amplifying Wellbeing at Work and Beyond,” research from Gallup and Workhuman found that employees who don't have meaningful connections at work are up to nine times more likely to be disengaged.
Similarly, employees who don't have a strong sense of belonging are up to 12 times as likely to be disengaged.
How does recognition show up in employee engagement data?
Recognition can have a huge impact on engagement, but studies often measure this effect in multiples instead of percentage points. Because recognition statistics are often reported differently from other employee engagement and retention statistics, they're worth separating from the rest of your dataset.
Recognition and engagement levels
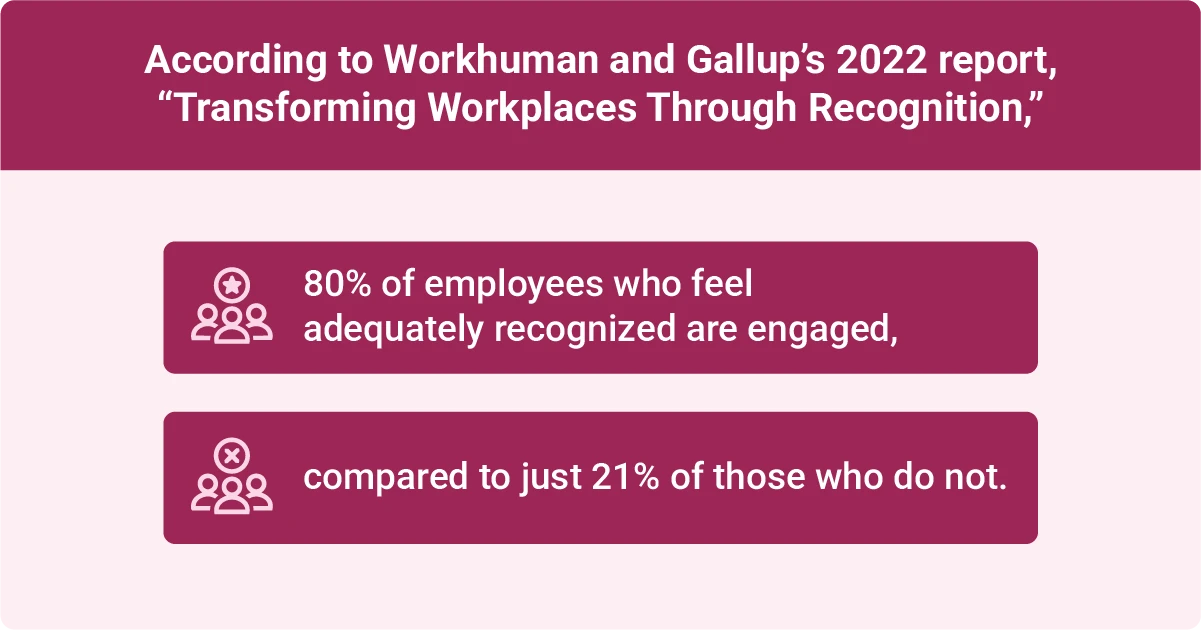
Everyone wants to feel appreciated, which is why frequent recognition often leads to higher engagement. A 2022 Workhuman and Gallup report, “Transforming Workplaces Through Recognition,” found that 80% of employees who strongly agree that their recognition needs are met are engaged, compared to only 21% who don't feel that way.
Of course, the quality of the recognition also matters. Another Workhuman and Gallup study published in 2023, “Empowering Workplace Culture Through Recognition,” found that employees who receive great recognition are 20 times more likely to be engaged than those who receive poor recognition.
The report defines great recognition as:
- Authentic
- Embedded in the organization's culture
- Fulfilling employees' recognition expectations
- Equitable
- Personalized
What happens when recognition is missing?
Engagement tends to decline sharply without regular recognition. According to the 2022 Workhuman and Gallup study, “Transforming Workplaces Through Recognition,” unrecognized employees are eight times as likely to be actively disengaged and four times more likely to look for another job.
Employee engagement statistics provide valuable benchmarks, but improving engagement requires understanding what employees experience every day.
Workhuman's recognition software helps organizations strengthen workplace connections, build a culture of appreciation, and uncover insights that can inform employee engagement strategies.
FAQs
How has employee engagement changed over the past decade?
Employee engagement has declined from its recent peak. Gallup research shows the percentage of employees who were engaged worldwide declined from 23% in 2022 to 20% in 2025. In the U.S., only 31% of employees were engaged in 2025, compared to 33% in 2021.
Which countries and regions report the highest and lowest employee engagement?
Gallup data shows that Uzbekistan had the highest employee engagement rate in 2025 at 46%, while Egypt and Pakistan had the lowest at 4% each. The U.S. and Canada were the most engaged regions at 31%, while Europe was the lowest at 12%.
Is employee engagement the same as employee satisfaction?
No, employee engagement measures how much workers care about their jobs and how much effort they put in. By contrast, employee satisfaction is how content workers feel with their jobs. An employee could be highly satisfied but have low engagement or vice versa.
How engaged are managers compared with the employees they lead?
Managers are only slightly more engaged than their employees, according to Gallup data. In 2025, only 22% of managers were engaged globally, down from 31% in 2022. Meanwhile, 20% of employees were engaged globally that year, a difference of only 2%.
Do company leaders treat employee engagement as a business priority?
Many executives recognize that employee engagement can have a significant impact on employee retention, productivity, profitability, and other business outcomes. By making employee engagement a top priority, your organization may meet its goals more effectively. It can also increase employee wellness and workplace culture.

Ryan Stoltz
Ryan is a search marketing manager and content strategist at Workhuman where he writes on the next evolution of the workplace. Outside of the workplace, he's a diehard 49ers fan, comedy junkie, and has trouble avoiding sweets on a nightly basis.
Recommended for you